Configure WorkSpaces Performance Metrics
Click can be configured to report per-WorkSpace performance metrics, retrieved from CloudWatch. This setting is disabled by default but can be enabled by navigating to the Settings > WorkSpaces section of the Click Dashboard.
Enabling and using this feature will incur a small cost in your AWS Account. Click uses the CloudWatch
GetMetricStatisticsAPI to retrieve performance metrics. Visit the CloudWatch Pricing page for more details. These API calls only happen on-demand when loading an individual WorkSpace's page in the Click dashboard. The CloudWatchGetMetricStatisticsAPI Call costs $0.01 per 1,000 requests.
To view Performance Metrics for an individual WorkSpace, click on its WorkSpace ID from the WorkSpaces dashboard. The performance metrics view can be customized to show one of eleven metrics exposed by the CloudWatch API and spanning a customized date range.
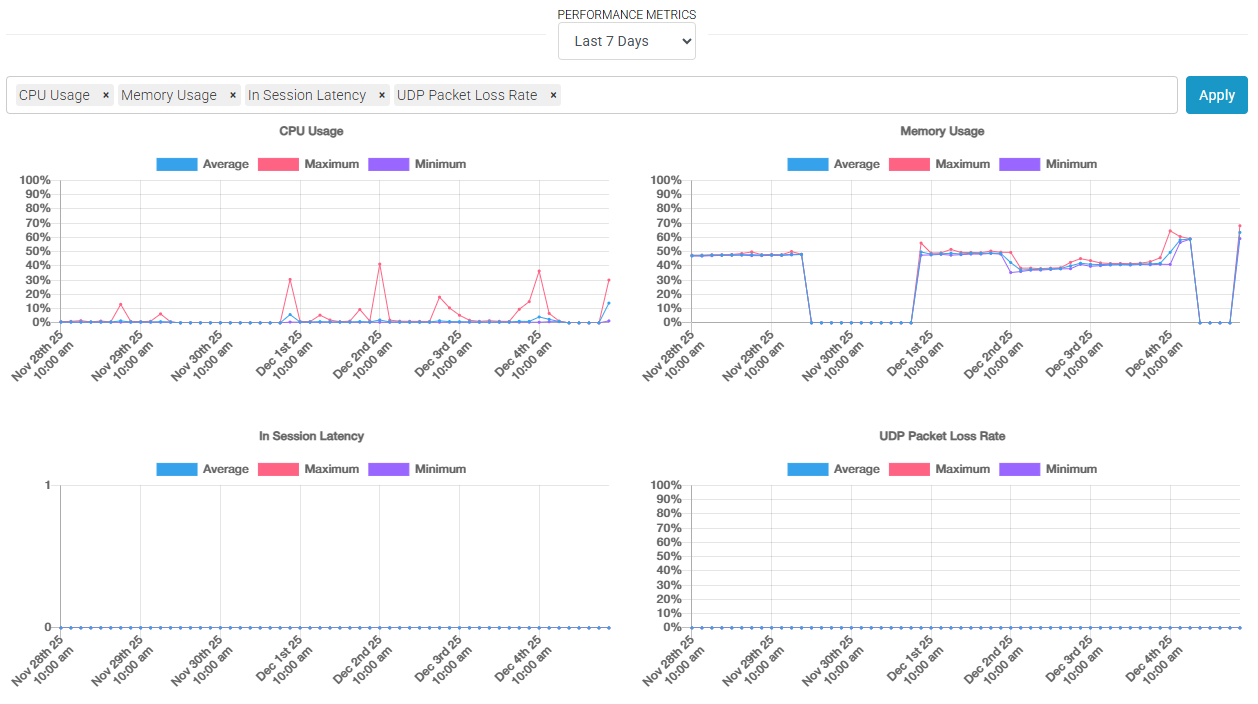
By default, Click will show performance metrics from the last seven days and will show details of the WorkSpaces's CPU Usage, Memory Usage, In-Session Latency, and UDP Packet Loss Rate. Note that the In-Session Latency metric is the latency between the end user's local WorkSpace client and the WorkSpace.
Pricing Example: Your team views 100 WorkSpaces per day with the default four metrics displayed. 30 days x 100 WorkSpaces x 4 metrics = 12,000 Requests * $0.01 per 1,000 requests = $0.12 per month
Updated 7 months ago